Free Video Resources for Data Visualization Inspiration

How I use conference and process videos to get ideas and learn new techniques

Naming guidelines for boolean variables

2 simple rules to keep your APIs clean, concise, and consistent

Visualizing Pathology Data: Colin Megill Interview

Colin Megill's interview with Shirley Wu on Nextstrain, a tool for visual analysis of coronavirus (COVID19)/pathology data

2019 Conference Reflection

8 Lessons from React Boston + React Conf ⚛️

Graphic Train Schedules of the MetroNorth

Remaking a classic from Edward Tufte's Visual Display of Quantitative Information

creative coding

Mixing Gatsby, MDX, ObservableHQ, and p5js

How to include Observable Notebooks in Markdown with Gatsby MDX

Techniques for Visualizing High Dimensional Data

How to visualize multiple features of your data

Learning

Frontier Tech and Frontend: March Meetup Notes

Takeaways from MachineMetrics, Hydrow, Facebook VR, and Lazy Loading

Tools

How to Visualize Visual Project Changes

Why + how to make GIF animations of your data visualization process

Remake: Marginal Histograms in Semiotic

Exploring a technique for de-cluttering crowded data with Tableau and Javascript

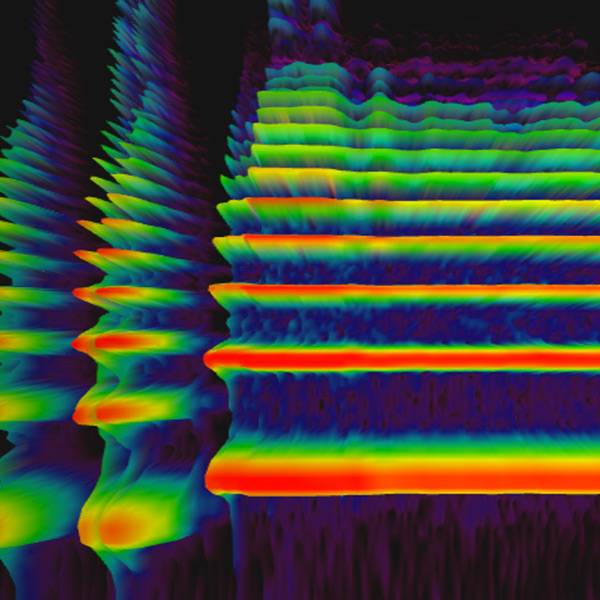
How to Visualize Music and Sound Data

Visualization techniques for complimenting the listening experience

Loading Dangerously: PyYAML and Safety by Design

On designing APIs, and the challenges faced in switching to safety by default

data science

Data Science Spotlight: Jennifer Shin

Papers, articles, and talks by Jennifer Shin, data scientist

Learning

Links #1: Data Stories and Mental Models

Machine Learning Tools, Data Visualization, Mental Models, Engineering Process, and more

Simple React Design Patterns: Container/View

Resources about a useful design pattern in frontend development

Learning

What is serendipidata?

Information useful for purposes different from what its collector intended